10 Best Digital Storytelling Platforms Compared

Choosing a digital storytelling platform starts with deciding what kind of story you are producing. A reported article, a data visualization, an interactive map, a 360° tour, and an interactive application are all “digital stories,” but their structures differ. A tool specialized in one format can be very hard to use for another.
There is therefore no “best overall” platform.
This comparison looks at ten digital storytelling platforms by the medium they favor, the way they publish, the work they leave to your team, and what they cost. Prices were checked on official websites on September 15, 2026.
How to Choose a Digital Storytelling Platform
Before comparing feature lists, check what your story requires:
- Identify the main content of your story: is it text, changing data, a map, a 360° scene, or a branching narrative?
- Choose the right format: look for sections when text leads, data animations for charts, places for geographic stories, hotspots for spatial exploration, or logic for branching narratives.
- List every required output: web, embeds, self-hosted files, native apps, desktop packages, kiosks, and offline use.
- Identify who will handle updates: check roles, collaboration, version history, approvals, and whether an editor can make changes without rebuilding the experience.
- Check governance: hosting, custom domains, access control, analytics, security review, and data location.
- Calculate the cost for a full year: count creators, reviewers, published stories or apps, hosting, analytics, onboarding, and future revisions.
- Look at the free plan’s limits: free creation may mean a public project, restricted exports, or a separate publishing plan.
- Build the most complex scene: push the free plan’s limits on the most complex scene you can build.
The 10 Best Digital Storytelling Platforms by Use Case
Shorthand: Best for Editorial Long-Form
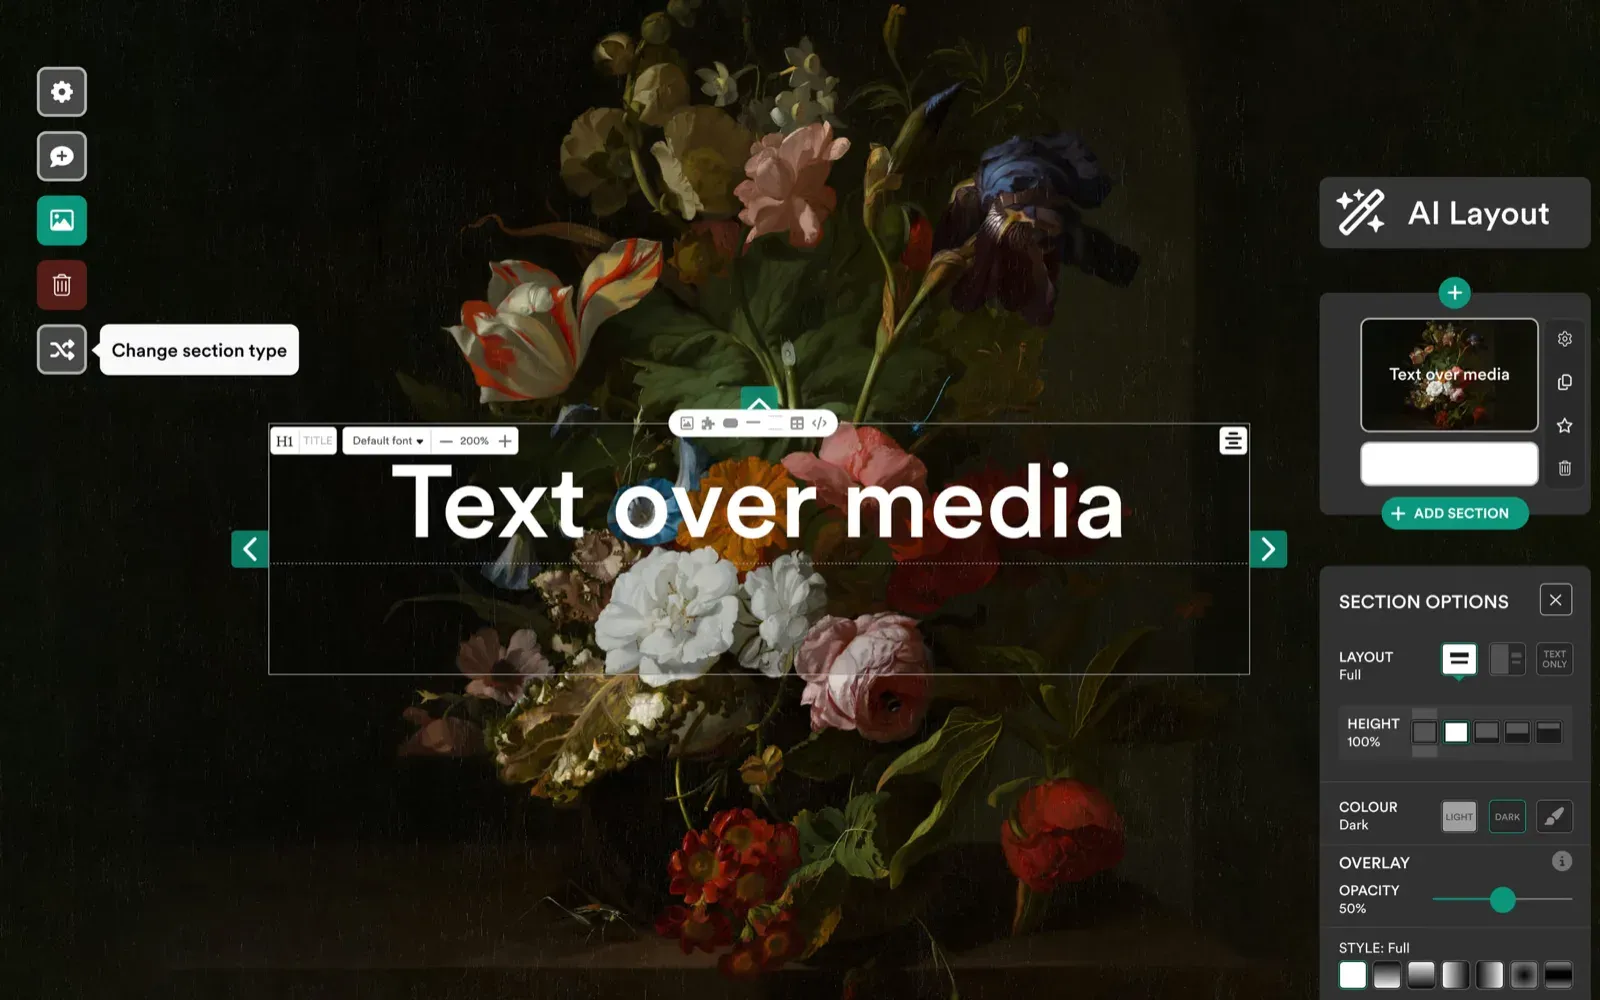
Shorthand is built around the story. Writers and designers assemble sections, media, and scroll effects into features, reports, magazines, and explainers. Stories can be hosted by Shorthand, embedded, or self-hosted through supported publishing routes. It fits teams whose main artifact remains an article, with visual pacing added.
That same tool becomes more restrictive when a story needs persistent variables, branching logic, or a kiosk package. Creating is free, but publishing prices are not public. Core covers twelve new stories a year; Unlimited and Enterprise serve higher-volume teams.
Best for
Not for
Flourish: Best for Data Storytelling
Flourish starts from data rather than pages. You select a chart, map, or interactive template, connect the dataset, and configure how the visual changes. Flourish Stories sequences those visualizations, including scrollytelling on Publisher.
Free includes unlimited projects and public publishing with attribution. Publisher adds teams, unbranded embeds, live updates from Google Sheets or CSV, and HTML export; Publisher and Enterprise prices are not public. Choose Flourish when data is at the heart of the story, not simply because the article contains a chart.
Best for
Not for
PandaSuite: Best for Custom Stories Beyond the Browser
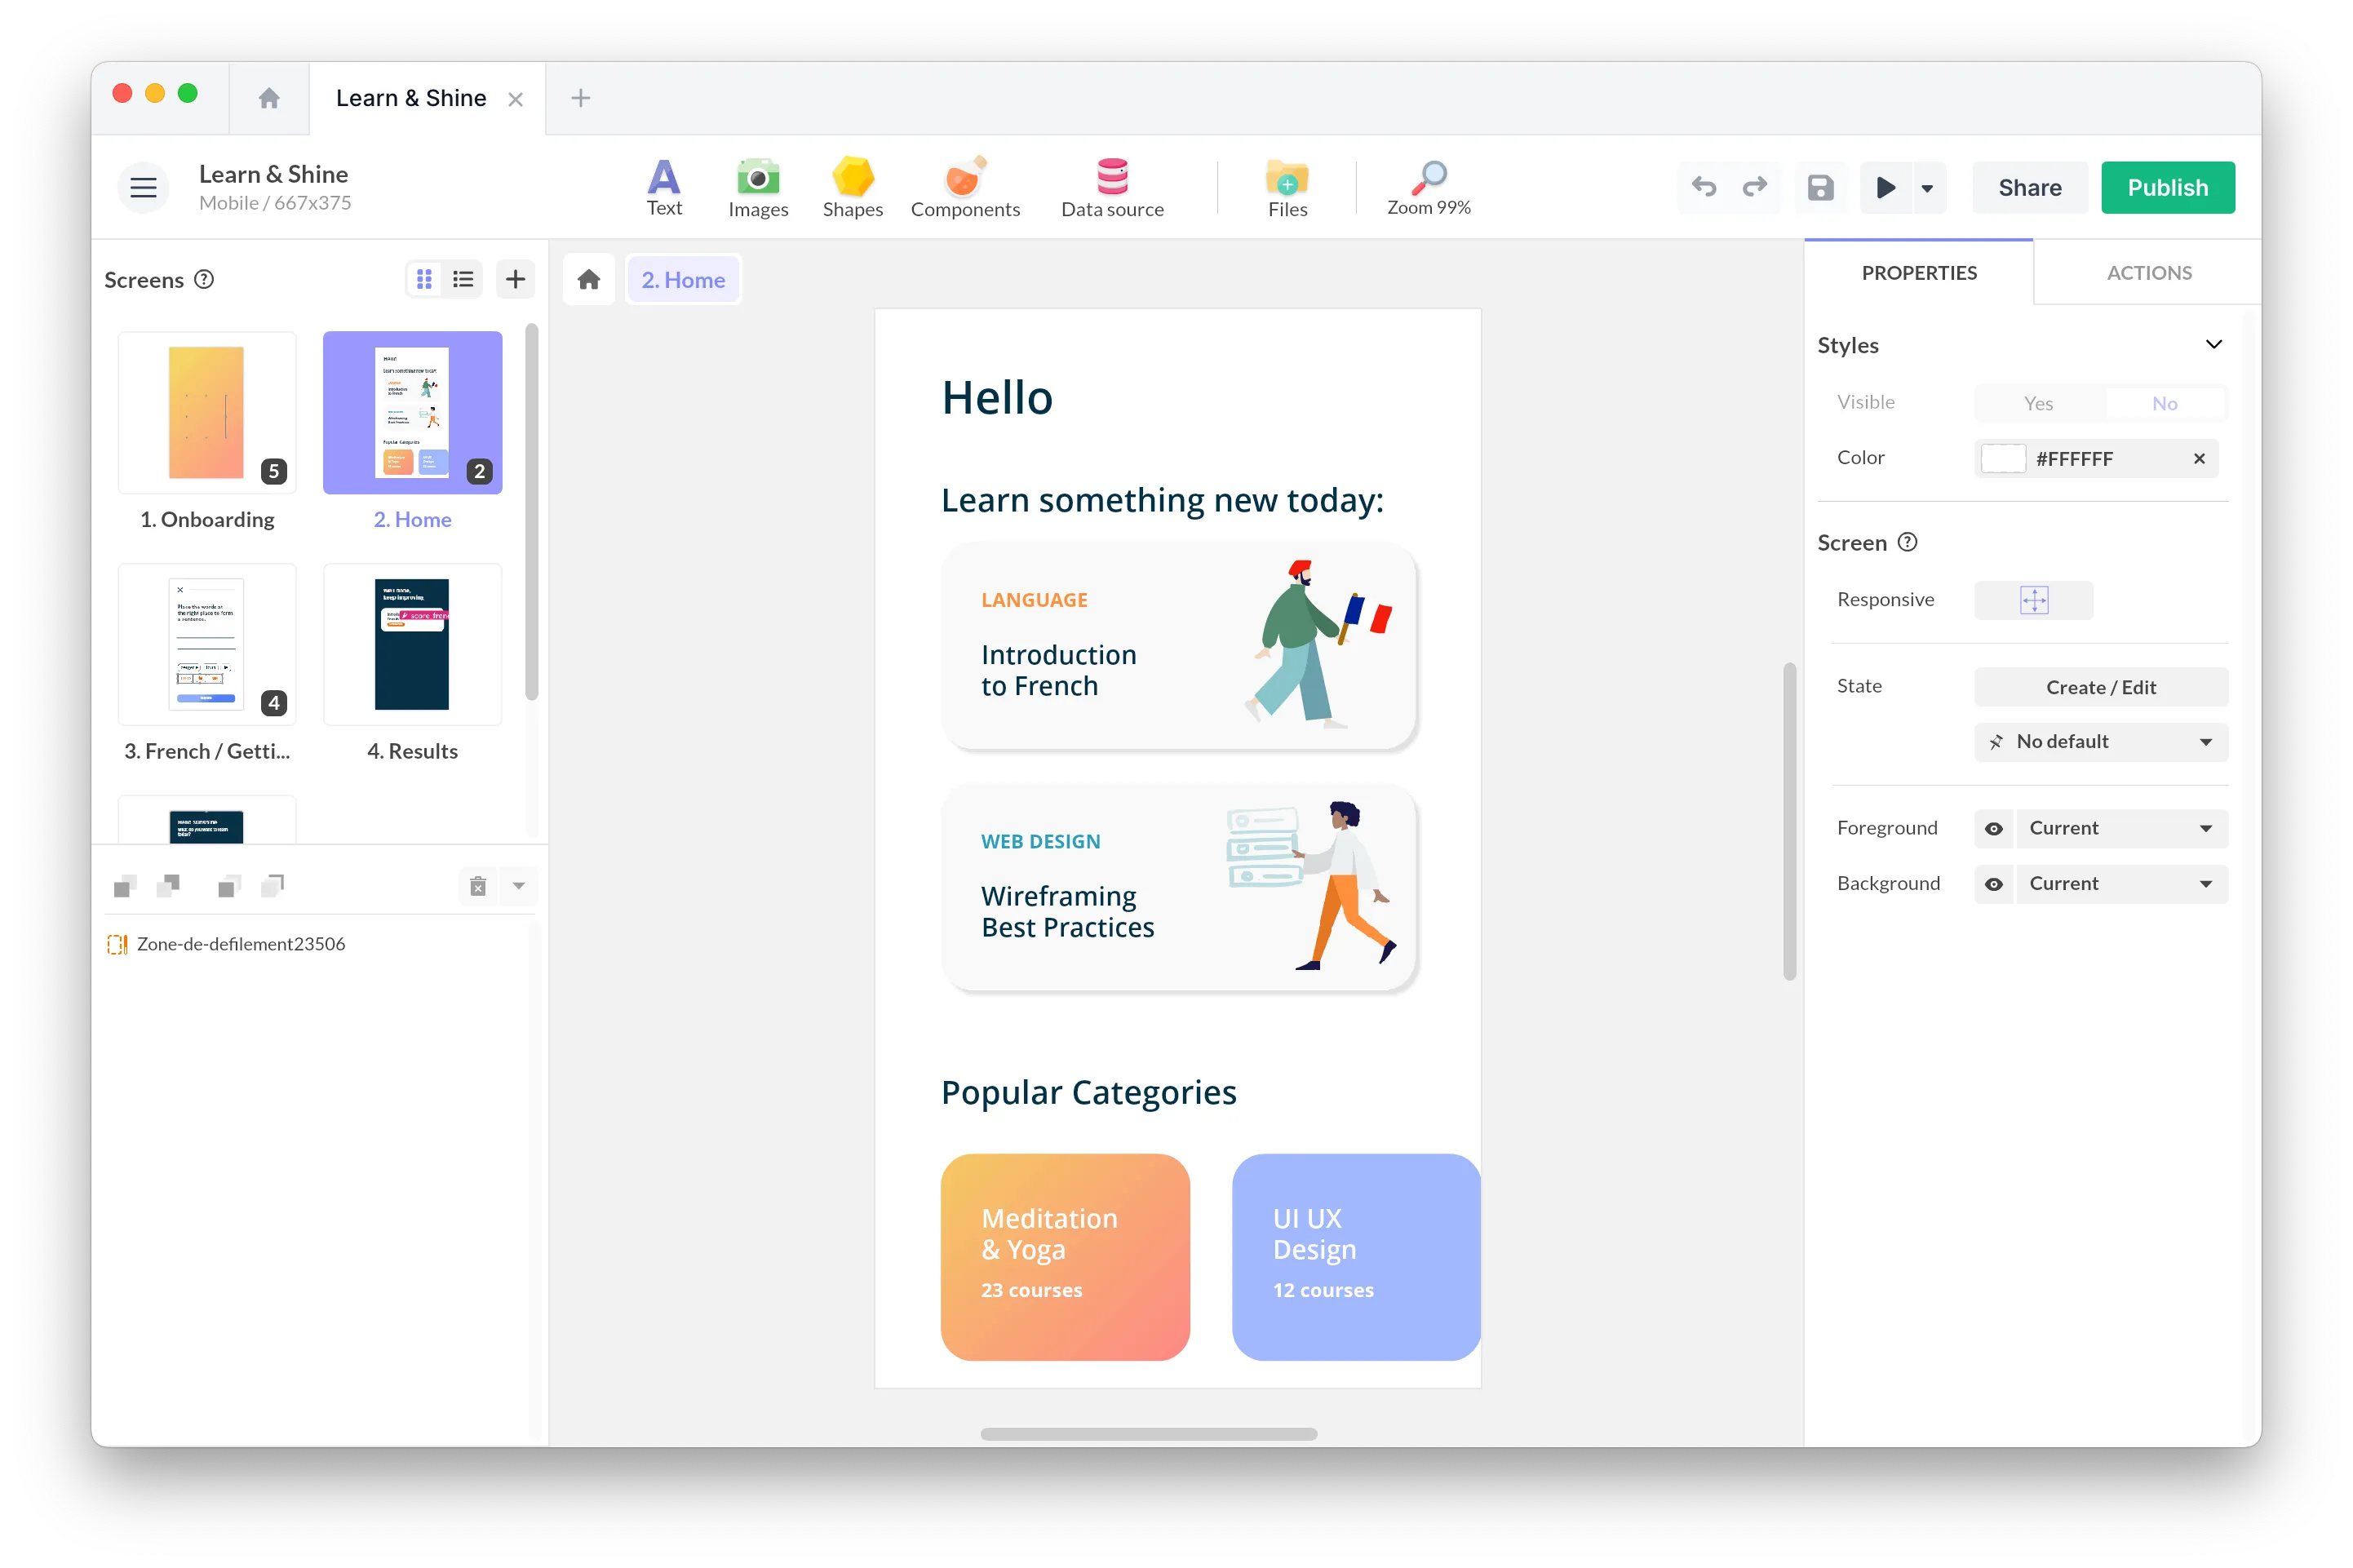
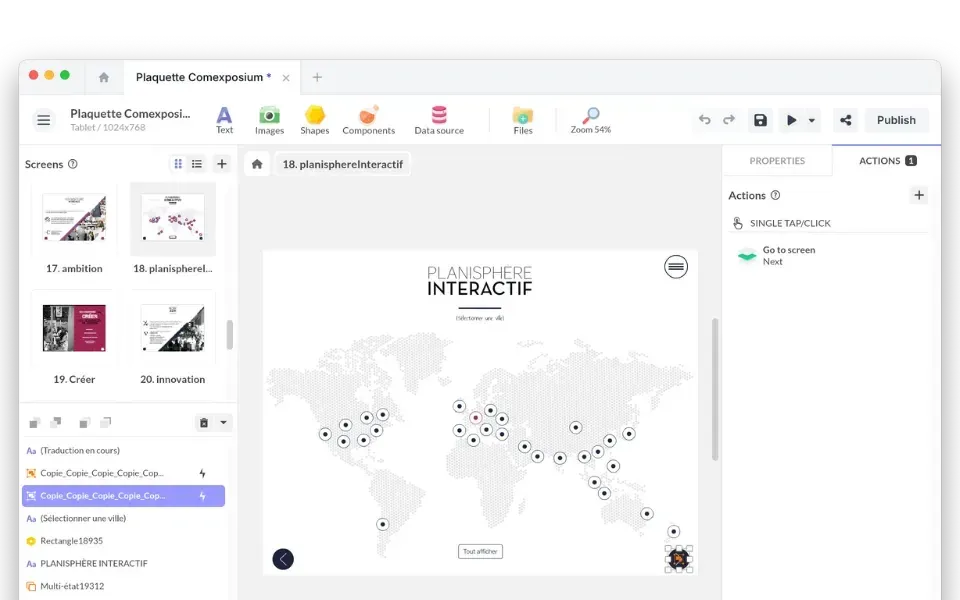
PandaSuite is an engine for creating interactive experiences. Instead of treating the story as a sequence of article sections, it brings screens, content, and logic into the same project. An author can define states, store a choice in a variable, and use a condition to open a different scene. The project can then run on the web, as a native or desktop application, on a kiosk, or offline. Ici tout va bien uses that freedom to make horizontal movement part of its illustrated journey.
Creation is free with one active project. Pro costs €24 per month annually; web publishing starts at €66 per month per application, billed annually.
Best for
Not for
ArcGIS StoryMaps: Best for Location-Led Stories
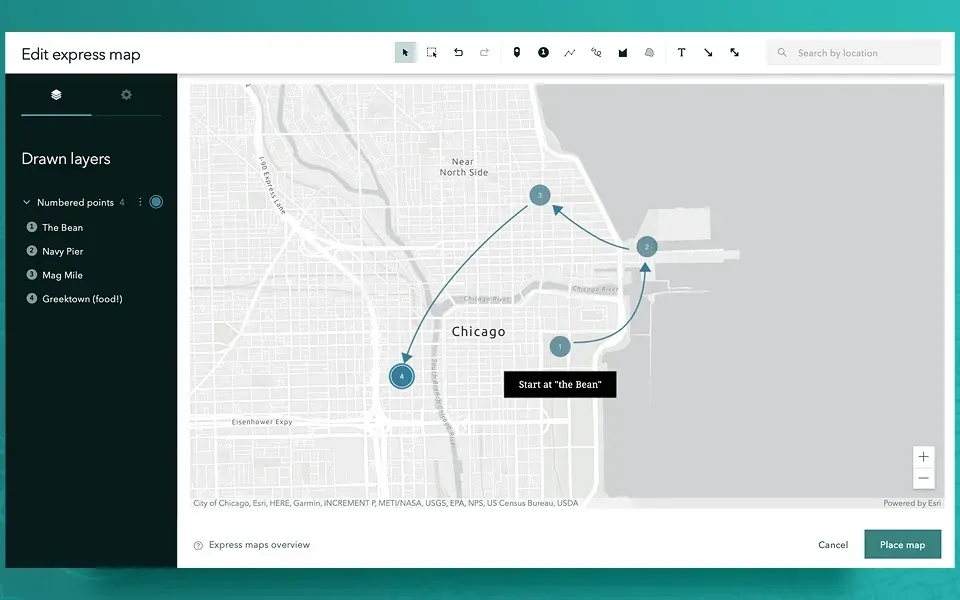
ArcGIS StoryMaps organizes a story around geographic information. Authors combine maps, 3D scenes, text, images, audio, video, and embedded content. Express maps handle simpler points, arrows, and areas; ArcGIS teams can reuse existing maps, scenes, and data.
Use it when location explains causality: a migration, ecological change, infrastructure project, or route. Otherwise, coordinates add a GIS-shaped workflow without adding meaning. StoryMaps is included with ArcGIS user types, so its price depends on the organization’s ArcGIS plan.
Best for
Not for
ThingLink: Best for 360° and XR Stories
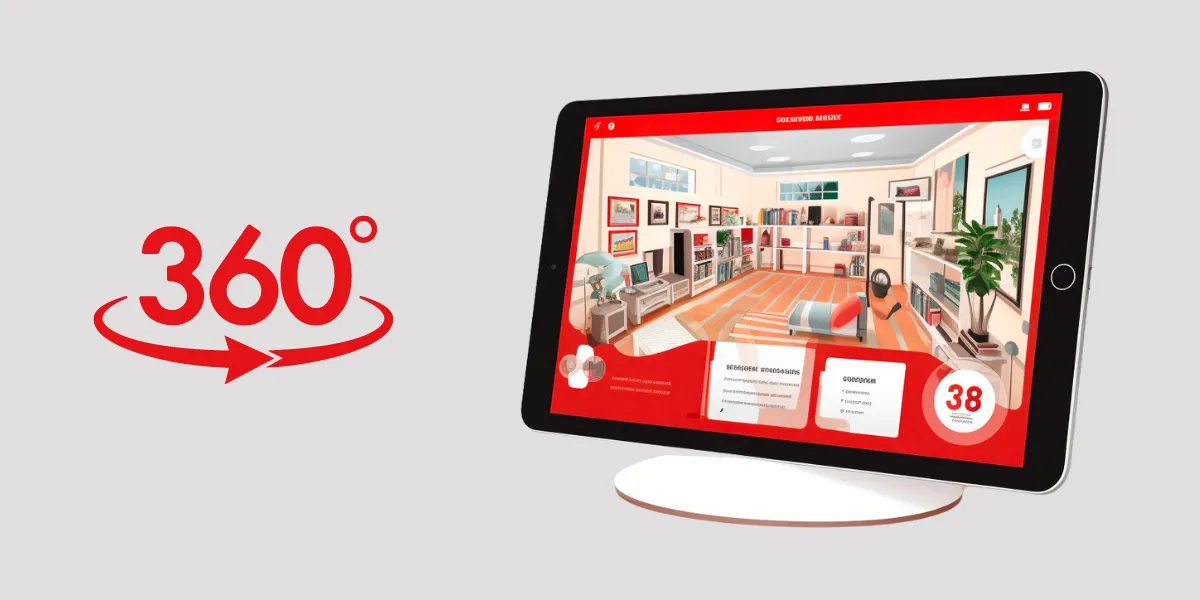
ThingLink treats an image, a video, a 360° scene, or a 3D asset as a space to explore. Creators add hotspots that reveal media and information, then link scenes into tours or training scenarios for web, mobile, and supported VR or AR hardware. This works for exploring a physical space: a site visit, a museum room, or an annotated object. It is less suited to an argument carried by a lot of text.
Create XR starts at €57 per month annually, or €86 monthly. Team starts at €425 per month annually for up to five creators; Business starts at €1,300 per month.
Best for
Not for
Genially: Best for Education and Gamified Stories
Genially uses pages, layers, animations, and interactive elements to build presentations, activities, games, infographics, and microsites. Templates, quizzes, branching scenarios, live presentation modes, and PowerPoint imports cover common education and training workflows.
Pro includes offline viewing, but not one project maintained across every web, mobile, desktop, and kiosk output. Free covers basic creation; Pro is €6 per month and Master €20 per month, billed annually.
Best for
Not for
Ceros: Best for Enterprise Interactive Marketing
Ceros is designed for marketing organizations that publish branded interactive content at scale. Studio combines freeform design, animation, interactions, templates, and publishing; reviewer roles, workspaces, versioning, analytics, security controls, embedding, export, and offline mode support the surrounding workflow.
The tiers are Starter, Growth, and Enterprise, but prices are not public. Starter offers one creator, three editors, and a trial. This is therefore a product for organizations.
Best for
Not for
Vev: Best for Design-Led Web Experiences
Vev sits close to the boundary between visual design and web production. Designers compose responsive pages, editors update content, and developers can extend the system. Breakpoints, libraries, collaboration, custom domains, and embedding support campaigns and reports outside a conventional CMS template. Growth and higher plans add S3, SFTP/FTP, webhooks, and ZIP export, including assets for offline use.
Basic, Growth, Scale, and Enterprise are priced by team size, but every tier requires a quote. Its center of gravity also remains the web page rather than a native application or physical installation.
Best for
Not for
Knight Lab StoryMapJS: Best Free Tool for a Simple Map Narrative
StoryMapJS from Northwestern University’s Knight Lab is a free, focused tool for telling a sequence of events through places. Each slide pairs a location with text and media; a large image can replace the geographic map for a painting or historic plan.
Knight Lab recommends fewer than twenty slides and a subject with a strong location narrative. It warns against stories that jump around the map. There is no license fee and no dedicated support staff; advanced gigapixel stories require separate image hosting. StoryMapJS is a focused tool, not a general platform pretending to cover every format.
Best for
Not for
Canva: Best for Fast Visual Stories and Supporting Assets
Canva is the general-purpose visual production tool. It covers presentations, social graphics, documents, simple web publishing, video, and a large template library.
Canva can arrange a sequence and add links, media, and presentation behavior, but it does not model persistent state or custom branching logic. Free costs €0, Pro €110 per year, and Business €170 per year per person. Business includes Flourish, useful when the story needs data visualization rather than a chart exported as an image.
Best for
Not for
Which Platform Should You Choose?
Reduce the choice to the structure you cannot remove from the story:
- If you need text and editorial pacing, start with Shorthand.
- If you need data that changes on screen, start with Flourish.
- If you need advanced logic, choices, several devices, or offline operation, consider PandaSuite.
- If you need a place at the heart of the story, compare ArcGIS StoryMaps and StoryMapJS.
- If you are starting from the exploration of a scene, start with ThingLink.
- If you need educational content or a simple presentation, consider Genially.
- If it is a branded web campaign with team management, compare Ceros and Vev.
- If you mainly need visuals in several formats, Canva may be enough.
FAQ
What Is a Digital Storytelling Platform?
A digital storytelling platform is a tool for combining narrative with digital media and, often, interaction. It may organize the story as sections, data states, map locations, linked scenes, or screens with logic. That model matters more than the number of media formats it imports.
What Is the Best Free Digital Storytelling Platform?
There is no single winner. StoryMapJS covers short map stories; Flourish Free covers public data stories with attribution; Genially and Canva cover simpler visual formats. PandaSuite’s editor is free for one active project, but publishing costs extra. Choose the format first, then inspect the free tier’s publishing limits.
How Do I Choose a Digital Storytelling Platform?
Identify the story’s dominant medium, required output, and update workflow. Then compare the limits: attribution, hosting, exports, offline behavior, collaboration, analytics, and publication cost. Build one representative scene before committing.
Which Platform Is Best for Data Storytelling?
Choose Flourish when charts and data transitions carry the argument, or ArcGIS StoryMaps when the data is geographic. PandaSuite can combine data with branching logic or non-browser deployment, but requires more construction.
Can a Digital Story Work Offline?
Yes, if the platform provides an offline export or packages the story as an application. PandaSuite supports native, desktop, kiosk, and offline outputs. Ceros lists offline mode, Vev provides an offline ZIP on higher plans, and Genially Pro includes offline viewing. Test the actual output with the network disabled.
Start With the Constraint
Ask which part of the story must remain intact: editorial control, a map, a dataset, a 360° room, or a choice that changes the next scene. Once that constraint is explicit, much of the market falls away. What remains is practical: workflow, output, maintenance, and cost.
If your answer involves states, variables, conditions, or a story that must leave the browser, build one representative scene in PandaSuite. Creation is free, so the test can use your real content rather than a sales demo.